HTTP Log
The HTTP Log is the console’s raw record of what actually went over the wire, one row per send this session: SOAP, REST and gRPC, finished exchanges and failed sends alike. It resets when the workspace closes — for the persistent, re-sendable record, see History.
Read a row
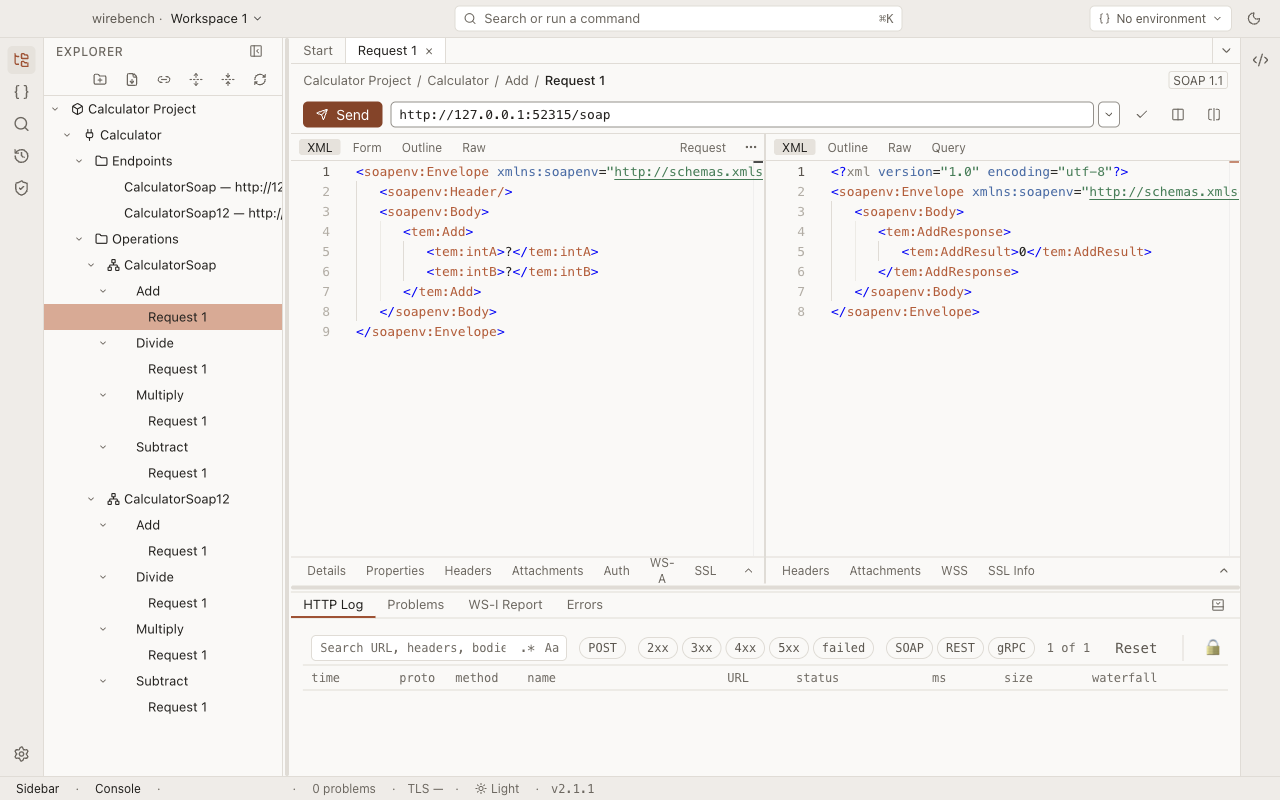
Section titled “Read a row”Each row shows the time, protocol, method, a name (if the send came from a saved request), URL,
status, duration, response size and a waterfall bar. A failed send has no size and shows its error
code (for example connection-refused), or Failed · before send when it never reached the wire,
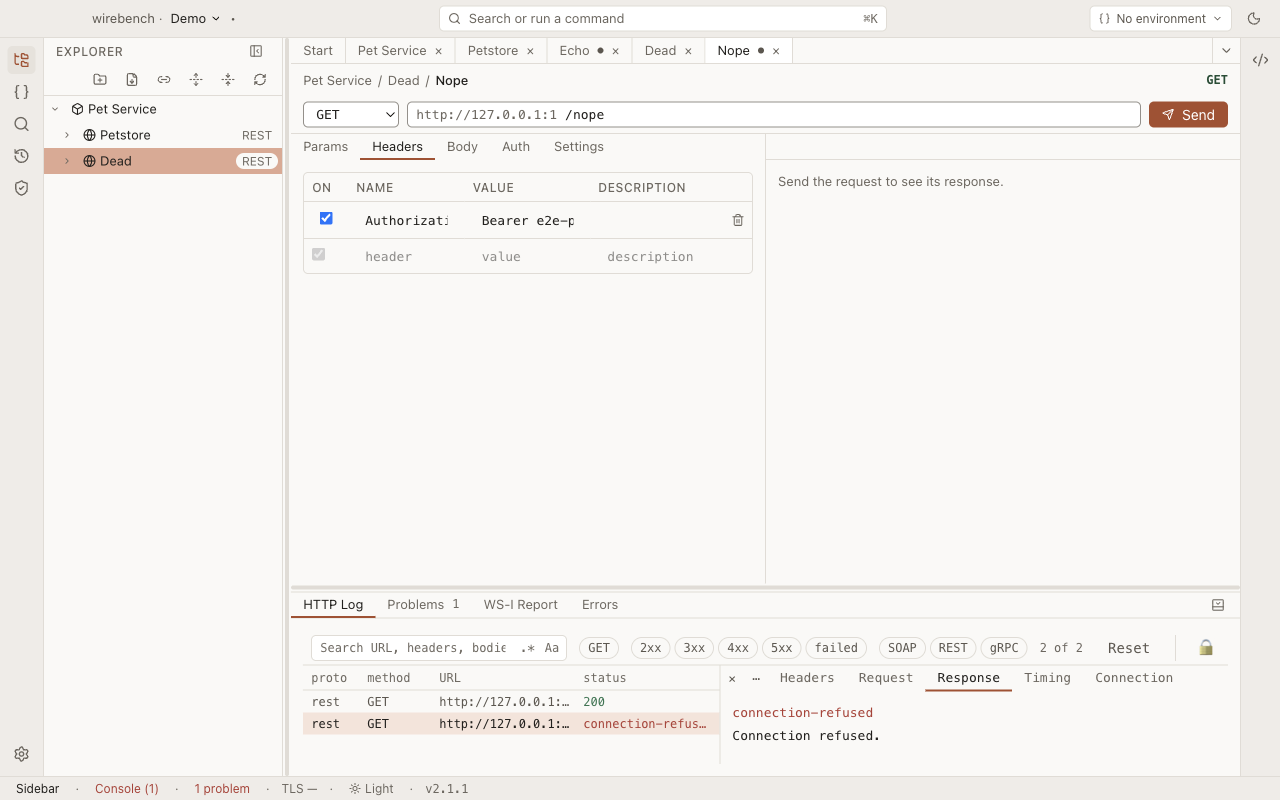
in place of a status. Select a row to open its detail pane, which narrows the table to four columns
(protocol, method, URL, status) to make room.
- Click a row to select it and open the detail pane beside the table.
- Use the tabs — Headers, Request, Response, Timing, Connection — to inspect it.
- Press Esc, or the × button, to close the detail pane.
- With the log focused, ↑ and ↓ move the selection, and the table scrolls to follow it. With nothing selected, ↓ picks the first row and ↑ the last.
- Click Time, Name, Status, ms or Size in the header to sort by that column; click again to reverse it.
Read timings
Section titled “Read timings”The Timing tab breaks a finished exchange into phases: DNS, connect, TLS, time to first byte,
and download. A phase reads n/a with a reason instead of a number when it wasn’t measured — DNS
is never measured at all, and connect/TLS are skipped when the send reused a keep-alive connection
or ran alongside other sends in flight; the tab notes “Connection reused — no connect or TLS phase”
when that’s why. A failed send has no phases: its Timing tab shows only the total time before
it failed, since the transport never got far enough to measure any of them.
Read the waterfall
Section titled “Read the waterfall”The waterfall column plots each visible row’s start and duration on one shared time axis, split into connect, TLS, wait (time to first byte) and download segments; hover a bar for the per-phase breakdown. It’s hidden while a row is selected, since the detail pane takes the space instead.
Compare two rows
Section titled “Compare two rows”- Select a row, then ⌘+click / Ctrl+click a second row.
- The pane in place of the detail shows a one-line summary of each (method, URL, status, duration), a table of request and response headers marked added, removed or changed, and the request and response bodies side by side — pretty-printed when both are JSON or both XML.
- Press Esc to go back to the newer row’s own detail; press it again to close the pane.
Read a failure
Section titled “Read a failure”A failed send — refused connection, TLS trust failure, timeout, or one that never reached the wire
(an invalid URL, a proxy lookup or an OAuth2 token fetch that failed while the request was being
built) — gets a row with a status column showing its error code, or Failed · before send for the
before-the-wire case. Its Response tab shows the error code and the engine’s message instead of
a body, plus a note that the request never went on the wire when it failed before send. Its
Connection tab shows the URL and method it was sent to, plus the peer’s certificate subject when
the failure was a TLS trust error. Headers for a failed send are redacted once, at the moment
they’re recorded, and stay that way — no unredacted copy exists, so the show-secrets toggle can’t
reveal them, and the Headers tab explains this with a note.
Filter and search
Section titled “Filter and search”- Type into Search URL, headers, bodies, name to match rows by URL, request and response header lines, the first 256 KiB of each body, and the request name. The .* toggle switches it to a regular expression; Aa makes it case-sensitive.
- Click chips in the Method, Status and Protocol groups to narrow further. Within a
group, selecting more than one chip is an OR (either matches); across groups it’s an AND. The
Status group includes
2xx,3xx,4xx,5xxandfailed. The Protocol group is SOAP, REST and gRPC. - The count on the right reads “n of m” — rows shown of rows in the log.
- Choose Reset to clear the filter without touching the log itself.
Show or hide secrets
Section titled “Show or hide secrets”The lock button toggles whether redacted values in the log are shown or masked. It affects the whole session’s log at once, not just the selected row.
Keep rows across a switch
Section titled “Keep rows across a switch”Preserve log keeps the log’s rows in memory when you close or switch a workspace, instead of starting empty. It’s never written to disk, and it’s off again at every launch. The number of rows the log keeps before dropping the oldest is HTTP Log rows kept in Preferences → UI (100–5000, default 500).
Copy, resend or open a row
Section titled “Copy, resend or open a row”Right-click a row, press its detail pane’s ⋯ button, or press Shift+F10 on the selected row, to open its menu:
- Copy as cURL (POSIX) / Copy as cURL (PowerShell) — the request as it was actually sent.
- Copy URL, Copy request headers, Copy response headers, Copy response body.
- Resend — sends the saved request behind the row as it is now, not as it was when logged. Off when the row wasn’t from a saved request, the request no longer exists, or the row’s response was a streaming one (a server-streaming or bidirectional gRPC method, a WebSocket session, or a REST response that was an event stream) — those need the editor instead.
- Open request — opens the saved request’s tab. Off when the request no longer exists.
A failed send has no response, so its response-copying actions are off.
Export HAR
Section titled “Export HAR”Export HAR saves the rows the filter currently shows, in the order displayed, as a HAR 1.2
file. Headers, URL parameters, WS-Security passwords and JSON/form secrets are always masked in
the file, regardless of what the show-secrets toggle shows on screen. A failed send’s entry carries
an _error field with its code, message and stage; a truncated body carries _truncated.
Limits
Section titled “Limits”- The log is session-only: it isn’t written to disk, and it’s dropped when the workspace closes unless Preserve log is on. For a persistent record, use History.
- It holds the number of rows set by HTTP Log rows kept in Preferences (100–5000, default 500); older rows are dropped as new ones arrive.
- Search covers the first 256 KiB of each body; matches past that point aren’t found.
- A failed send’s headers are redacted permanently at the moment they’re logged — there’s no way to recover the unredacted values later, unlike a finished exchange’s.
- The Query tab and other response tooling live in the request editor’s own response pane, not here — the HTTP Log only shows the raw exchange.
Related
Section titled “Related”- History: the persistent, re-sendable and diffable record of your own sends.
- Secrets
- Preferences and layout
- REST
- SOAP and WSDL
- Authentication